Wednesday, August 27, 2008
Thematic Map
Thematic Maps are data maps created to portray a specific subject or for a specific purpose. They reflect some particular themes about a geographic area. They portray such aspects of a city, state, region, nation, or continent as social, political, cultural, economic, sociological, agricultural, or any other aspects. In short, thematic maps tell a story about a place.
The above thematic map tells the story (or at least it's end result) of the 2004 Presidential Election of Bush vs. Kerry. It illustrates through color the political orientation of each state at the conclusion of the 2004 election. Using the patriotic colors of red, white and blue for this thematic map are illustrative of its political theme. The colors are also indiciative of each political party's candidate: red for Bush, a republican; and blue for Kerry, a democrat.
http://www.weburbanist.com/wp-content/uploads/2007/06/united-states-political-map.jpg
Monday, August 25, 2008
Topographic Map
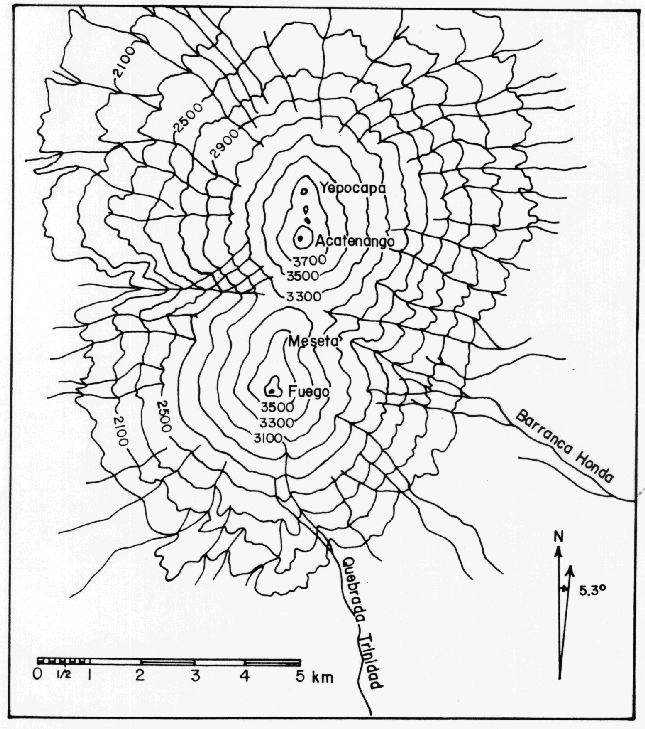
Topographic maps use contour lines to portray the differing shapes and elevations of land. They capture the 3-dimensional aspect of the terrain being illustrated on a 2-dimensional surface. (Contour lines are imaginary lines that join points of the same elevation on the land's surface, above or below a reference surface, i.e. sea level.)
The map above is a simple topographic map of the Fuego and Acatenango volcanic complexes in Guatemala. Fuego is one of Guatemala's 4 active volcanoes.
The circular rings (contour lines) illustrate the increasing elevation of each volcanic peak. The largest outer ring indicates the base of the volcano, with each progressive ring illustrating a higher elevation up the mountain, until reaching the volcano's peak (the smallest ring, with highest elevation).
http://www.geo.mtu.edu/volcanoes/fuego/pic/f29.gif
Friday, August 22, 2008
Planimetric Map
Planimetric maps are maps that represent/portray the horizontal positions of features and places using lines and symbols, while vertical information is specifically ignored. They are surface maps with no relief features. An example of a planimetric map would be a street map, or even an organizational flowchart, mapping out the organizational levels of a large company.The above planimetric map gives a detailed layout of a portion of a neighborhood, illustrating the horizontal position of streets, buildings, and even shrubbery. This map use symbols and colors to illustrate features and their shapes, such as the double lines indicating roads, green squiggles which represent trees/bushes, etc... It also portrays underground features, i.e. storage tanks.
Wednesday, August 20, 2008
Mental Map
Mental maps are described as a person's perception of the world; they are an individual's own internal map of their known world. It represents what the person understands about the locations and characteristics of places at a variety of scales.
This map was drawn by a student in Thailand. It illustrates his own internal perception of the world we live in: where countries are located in relation to one another; the countries that are known to him; his understanding of the relative sizes of countries; etc.
While it may not be precise, this student's mental map illustrates how he perceives the layout of the world, based on his experiences and what he has been taught.
http://go.owu.edu/~jbkrygie/krygier_html/geog_222/geog_222_lo/geog_222_lo13_gr/sketch_proj.jpg
Subscribe to:
Posts (Atom)