Wednesday, October 29, 2008
Histogram
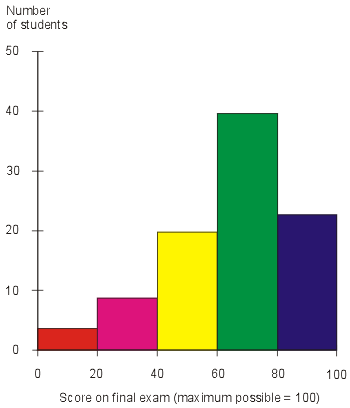
A histogram is a graphical display of frequencies, shown as bars. It shows what proportion of observations fall into each of several preset categories. A histogram differs from a bar chart in that it is the area of the bar that denotes value, not the height as in bar charts. The histogram above shows frequencies of exam scores, and the area under each segment is directly proportional to the number of scores falling into that category.
http://media.techtarget.com/digitalguide/images/Misc/iw_histogram.gif
Subscribe to:
Post Comments (Atom)


No comments:
Post a Comment