skip to main | skip to sidebar

Monday, October 13, 2008

Standardized Choropleth maps


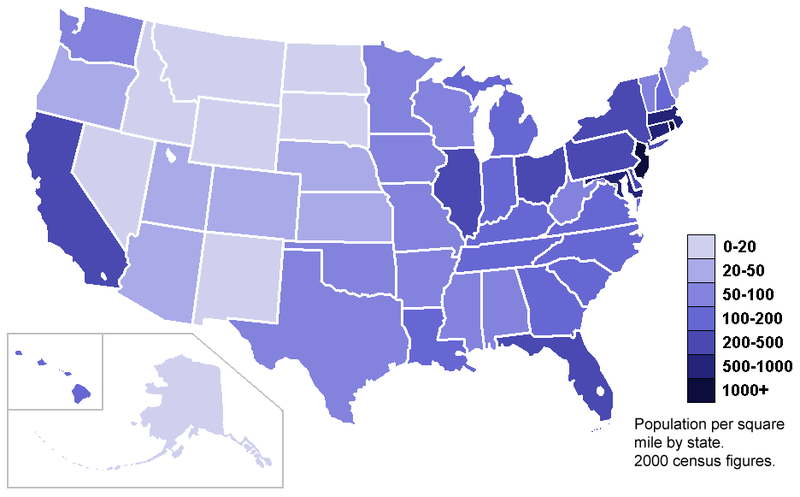
The data/information portrayed in standardized choropleth maps is "standardized" or "normalized", which allows for comparison of distribution among different areas.

The standardized choropleth map shows population density according to the states' areas in square miles.

http://upload.wikimedia.org/wikipedia/commons/thumb/7/78/USA_states_population_density_map.PNG/800px-USA_states_population_density_map.PNG
Posted by Molly Rose at 8:32 AM

No comments:

Post a Comment

Newer Post Older Post Home
Subscribe to: Post Comments (Atom)

Molly's Map Catalog - GIS 3015

Blog Archive

  • ▼  2008 (54)
    • ►  November (5)
    • ▼  October (19)
      • Histogram
      • Parallel Coordinate Graph
      • Triangular Plot
      • Windrose
      • Climograph
      • Population Profile
      • Scatterplot
      • Index Value Plot
      • Accumulation Line Graph or Lorenz Curve
      • Bilateral Graph
      • Google Earth - Remote Sensing
      • Nominal area Choropleth Map
      • Unstandardized choropleth Maps
      • Standardized Choropleth maps
      • Univariate Choropleth Maps
      • Bivariate Choropleth maps
      • Unclassed Choropleth Maps
      • Classed Choropleth Maps
      • Range Graded Proportional Circle Map
    • ►  September (26)
    • ►  August (4)

About Me

My photo
Molly Rose
View my complete profile